using java and gnuplot “stupid way but it worked :D”
java code
public class Main {

public static  double root1(double insid){

double a=(Math.pow(insid,2))/4;

double roota=Math.sqrt(a+kw);

double hyd=roota-(insid/2);

return hyd;

}

public static  double root2(double insid){

double a=(Math.pow(insid,2))/4;

double roota=Math.sqrt(a+kw);

double oh=roota+(insid/2);

return oh;

}

static double sid;

static	double kw=4.4*(Math.pow(10,-14));

static double h;

static double oh;

public static void main(String[] args) {

double sidmin=-1*Math.pow(10,-6);

double sidmax=1*Math.pow(10, -6);

double interval = 1*Math.pow(10, -7);

for (sid=sidmin; sid <=sidmax; sid=sid+interval ){

h=root1(sid);

oh=root2(sid);

System.out.println(sid + "t" + h+"t"+ oh);

}

}

}
gnuplot code “data saved in file.txt”
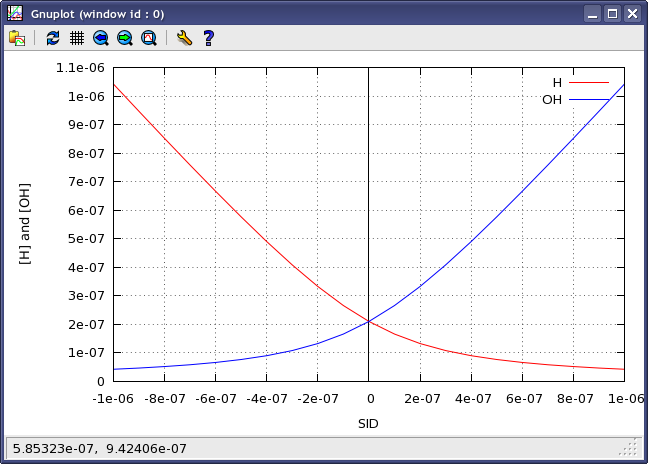
set  xlabel " SID "

set  ylabel " [H] and [OH] "

set yzeroaxis lt -1

plot "file.txt" using 1:2 with lines title "H" , "file.txt" using 1:3 with lines lc 3 title"OH"